
It’s a sign of how much trouble we’re in when a budget deficit of a half trillion dollars seems like fiscal restraint.
It is progress, given that annual budget deficits were running above $1 trillion a year throughout President Obama’s first term and have been as high as $1.4 trillion. And it could have been worse. Recall the effort made by President Obama to stop the automatic spending cuts that took place when sequestration was adopted.
But a half trillion dollars is still a mountain of money. It helps to give the number some context.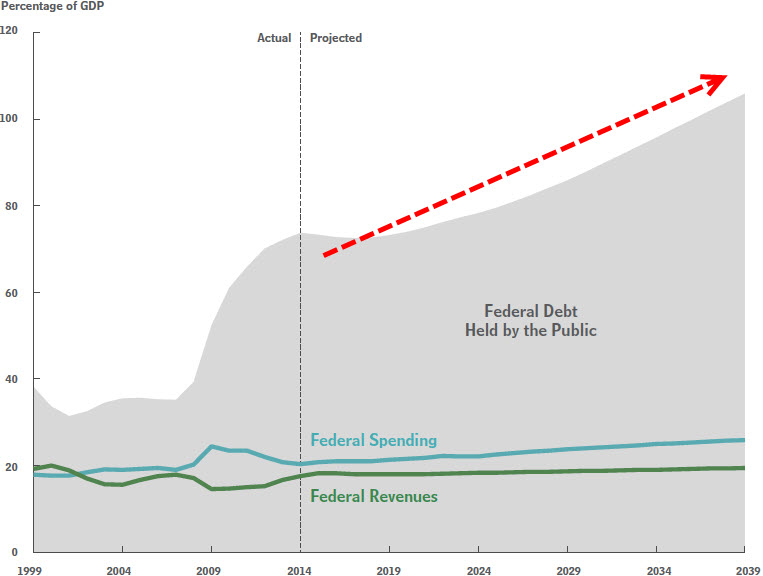
To reach a half trillion dollars, you would have to spend $8 per second beginning with the year 0 and continue spending through today. If you had a stack of $1 bills adding up to $500 billion and were able to put them one on top of another, the stack would be 34,000 miles high.
Keep that in mind and consider a few projections from the Congressional Budget Office’s long-term budget outlook, which was released last week. Keep in mind, too, that the CBO, although allegedly nonpartisan, is a government entity and tends to make overly optimistic projections.
- The federal debt, which now exceeds $17.6 trillion, will increase by $40 trillion over the next two decades. That’s an average of $2 trillion per year. And this projection is based on Congress taking action to rein in spending.
- Under an “alternative baseline” included in the report, the federal debt will increase by $10 trillion over the next decade, then by an additional $100 trillion over the two decades that follow.
- This bleaker projection is based on Congress continuing its current policies. Writing in The Wall Street Journal, U.S. Senator Rob Portman noted that the projection assumes there will be no recessions, wars, terrorist attacks or natural catastrophes that would further burden the federal budget, and that interest costs on the national debt will remain at near-historic lows.
Keep in mind that 77 million baby boomers have begun retiring, which will place additional strain on Social Security, Medicare and other government services. The price of implementing Obamacare is another burden.
As the CBO puts it, “the pressures of an aging population, rising health care costs, and an expansion of federal subsidies for health insurance would cause mandatory spending to rise as a percentage of GDP.”
As the chart above demonstrates, even if federal spending is kept in check, relatively speaking, federal debt held by the public will escalate at a frightening rate. You may or may not be worried about the level of debt 25 years from now, but do you want to leave your children with a debt load of $100 trillion?
Servicing the Debt
How can debt increase so rapidly, even if spending remains relatively steady?
With baby boomers retiring and Obamacare being implemented, it’s no surprise that healthcare costs will rise significantly, along with the cost of Social Security. The third major increase will be in the cost of servicing the debt.
This year, according to the U.S. Treasury, debt service will cost $354,863,251,628.78. That nearly $355 billion is the cost of excessive spending. There is no return on that investment. It can’t be used to help the poor, rebuild our roads and bridges, or protect the country.
Note in our second chart that the cost of “net interest” will more than double over the next 25 years. As grim as it may seem, that projection may be far too rosy. One reason for the increase is that the amount of debt we’re servicing continues to increase.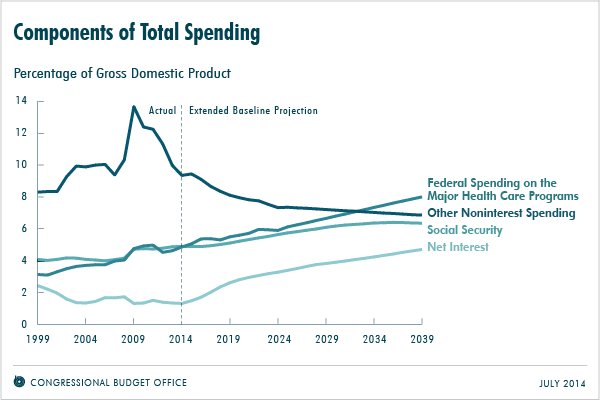
As The Washington Times reported, “Raising the 40-year average federal debt-service cost of 2.2% by the same factor as the federal debt’s hike would boost federal debt-service costs to a whopping 4.2% of GDP — 2.6% higher than it was last year.”
Even more significant, the interest rates we pay on our debt are bound to increase.
“Combining these two adjustments — raising federal debt-interest costs to their 40-year average and then adjusting it for the federal debt’s increase — would add 2.6 percentage points of GDP to last fiscal year’s deficit, raising it to an extremely high 6.7% of GDP,” according to The Washington Times.
Convert 4.2% of GDP into fiscal 2013 dollars and you have $694 billion, which would make servicing the debt second in cost only to Social Security, which costs $803 billion, and larger than Medicare, which costs $495 billion.
Convert it to 6.7% of GDP and servicing the debt would cost $1.107 trillion.
What if the cost of servicing the debt increases beyond the 40-year average? As U.S. debt increases, the U.S. could be considered a less reliable borrower and the U.S. credit rating could drop, which would result in lenders charging a higher rate for the money the U.S. borrows.
As the CBO notes, “At some point, investors would begin to doubt the government’s willingness or ability to pay its debt obligations, which would require the government to pay much higher interest costs to borrow money.”
The higher the cost of servicing the debt rises, the less money consumers will have available to spend and businesses will have available to expand. Economic growth will stagnate, which will make it even more difficult to pay for servicing the debt, which will lead to even greater economic stagnation.
“With deficits as big as the ones that CBO projects,” according to the CBO report, “federal debt would be growing faster than GDP, a path that would ultimately be unsustainable.”
So why are our political leaders doing so little about the federal debt … except to make it bigger?