
Experiments show that if you put rats in a maze and give them a jolt of electricity when they go the wrong way, they will eventually go the right way.
Apparently, humans may not be that smart.
OK, we’re smarter than rats. We know better. But we believe what we want to believe. And right now, a majority of those who invest believe the “trend is our friend.”
We forget that what goes up must come down, regardless of how many bonds the Fed buys. It’s a scary world and no amount of irrational investor confidence can keep the market aloft forever.
In the first decade of the new millennium, we lived through two difficult bear markets, each of which chopped stock prices nearly in half. The bear market of 2000 to 2003 was caused by the irrational belief that tech stock prices moved in only one direction. The bear market of 2007 to 2009 was caused by the irrational belief that housing prices moved in only one direction.
So here we are just five years removed from the last bear market and investors are acting as though stock prices move in only one direction. Investors have already forgotten that bubbles burst.
Zerohedge compares investor behavior with criminal behavior, noting that even when criminals are caught and sentenced to jail, the rate of recidivism exceeds 40% nationally and 50% in some states.
As Zerohedge notes, “Those ‘Scared Straight’ programs you see on reality TV? Many criminal psychologists think they do more harm than good, and the data supports that point of view. So despite lifting equities to unsustainable levels twice in a generation, investors are perfectly capable of doing it again. Let the punishment fit the crime if this is the case.”
No one can say with certainty that we’re approaching another bear market or even a correction, just as no one can say with certainty that the S&P 500 and Dow Jones Industrial Average will continue to break new records.
But one thing is clear – investors aren’t being scared straight.
Reading the Signs
This week, the S&P 500 index (SPX) failed to hold its 21-day moving average and further declines came the next day along with a test of the 50-day moving average. During the day, a bullish push forward brought the SPX back up to the 21-day level, but failed to cross above 1850, which has become an important resistance level.
The Moving Average Convergence Divergence (MACD) is sending sell signals, while the McClellan oscillator put in a new low below the zero line. The MACD turns two trend-following indicators, or moving averages, into a momentum oscillator by subtracting the longer moving average from the shorter moving average. As a result, it tracks both trends and momentum.
Meanwhile, iShares 20+ Year Treasury Bond (TLT) has broken out to the upside of a two-month consolidation that formed a box pattern. This may be forewarning of a more significant decline in equities.
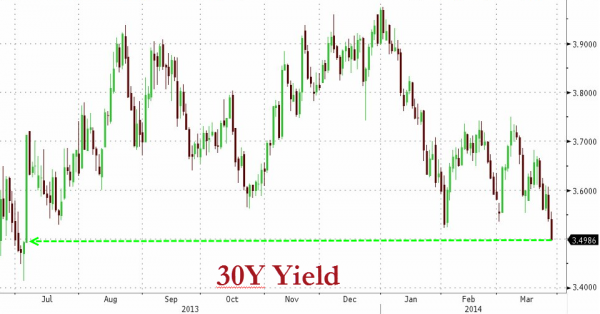 While the short end of the Treasury curve continues to re-price higher, yields for 30-year Treasury notes fell below 3.5% to their lowest intraday level since early July 2013. The result is a yield curve that is the flattest its been since September 2009.
There are plenty of signs telling us that it’s time to think like a rat.